Tokio Marine Group regards dividends as the basis of shareholder returns, and our policy is to increase dividend continuously in line with profit growth.
In addition, capital level adjustment will be carried out in a flexible manner, comprehensively taking into account the ESR level, M&A pipelines, business environment, and ROE targets, etc.
Commencement date of year-end dividend payments for FY2025
June 30, 2026
Dividend
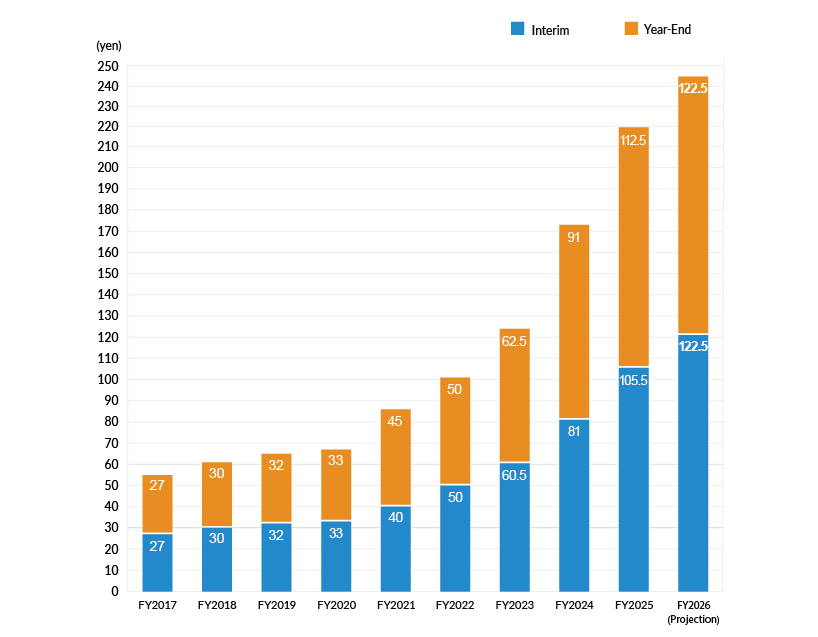
Dividend per Share Trends
| Fiscal year | Dividend per Share (yen) | Total amount of dividends to shareholders (Billions of yen) |
||
|---|---|---|---|---|
| Interim | Year-End | Annual (Total) | ||
| 2026 (Projection) | 122.5 | 122.5 | 245 | 460.6 |
| 2025 | 105.5 | 112.5 | 218 | 412.4 |
| 2024 | 81.0 | 91.0 | 172 | 333.2 |
| 2023 | 60.5 | 62.5 | 123 | 243.0 |
| 2022 | 50 | 50 | 100 | 200.2 |
| 2021 | 40 | 45 | 85 | 173.9 |
| 2020 | 33 | 33 | 67 | 173.9 |
| 2019 | 32 | 32 | 63 | 133.0 |
| 2018 | 30 | 30 | 60 | 128.0 |
| 2017 | 27 | 27 | 53 | 117.6 |
- The total amount of dividends paid to shareholders is based on the amount before reflecting the acquisition of treasury stock.
- Dividends prior to FY2021 are recalculated after the stock split (3 splits) in October 2022 (rounded to the nearest 1 yen).
- In addition to the ordinary dividend mentioned above, we paid a temporary dividend for capital level adjustment (FY2018 interim period: ¥23 per share, FY2019 interim period: ¥12, FY2020 interim period: ¥12).
Share Buybacks, etc
Trends of Adjustment of Capital Level (Share Buybacks, etc)
| Fiscal year | Adjustment of Capital Level (Share Buybacks, etc) |
|---|---|
| 2026 (Projection) | 400.0 |
| 2025 | 240.0 |
| 2024 | 220.0 |
| 2023 | 120.0 |
| 2022 | 100.0 |
| 2021 | 100.0 |
| 2020 | 50.0 |
| 2019 | 50.0 |
| 2018 | 125.0 |
| 2017 | 150.0 |
* Adjustment of capital level (share buybcks, etc.) is the total amount approved by the announcement date of financial results of each fiscal year (excluding FY2026).
Trends of the Cancellation of Shares held the Company
| Fiscal year | Number of shares to be cancelled | Number of issued shares (including treasury shares) after the cancellation |
|---|---|---|
| 2025 | - | 1,934,000,000 |
| 2024 | -44,000,000 | 1,934,000,000 |
| 2023 | -24,500,000 | 1,978,000,000 |
| 2022 | -37,500,000 | 2,002,500,000 |
| 2021 | -52,500,000 | 2,040,000,000 |
| 2020 | -13,500,000 | 2,092,500,000 |
| 2019 | -24,000,000 | 2,106,000,000 |
| 2018 | -114,073,125 | 2,130,000,000 |
| 2017 | -15,000,000 | 2,244,073,125 |
| 2016 | -13,500,000 | 2,259,073,125 |
-
* Figures before FY2021 are recalculated based on the stock split (3 splits) in October 2022.