At a Glance
Tokio Marine Group has built a highly profitable specialty insurance portfolio focused on developed markets comprised of a diversified portfolio, enabling it to weather market cycles and adverse events. This is complemented by high growth centers in emerging economies and underpinned by sustainable and profitable Japanese domestic life and non-life businesses.
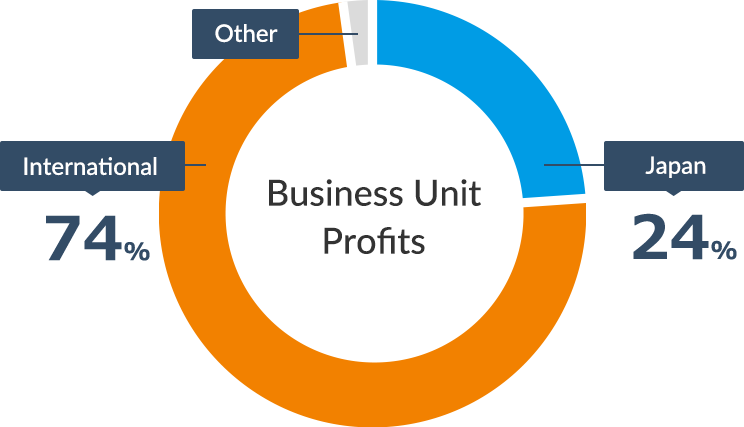
Tokio Marine Group's international and domestic businesses provide an equal share of its profits, with its comprehensive portfolio and global footprint providing multiple growth opportunities.
Results
Realizing stable business expansion, profit growth, and high capital efficiency
- Top-line(Net premiums written + Life insurance premiums)9.5trillion yen
- Adjusted net income950billion yen
- Adjusted ROE13.0%
-
*FY2026 projection (announced in May). Unless otherwise stated, all figures are based on IFRS.
-
*Definitions of Adjusted Net Income and Adjusted ROE have changed due to the transition to IFRS.
Composition of Profits
International business driving profit growth
-
*FY2026 projection (IFRS basis, announced in May)
-
*Excluding capital gains from sale of business-related equities
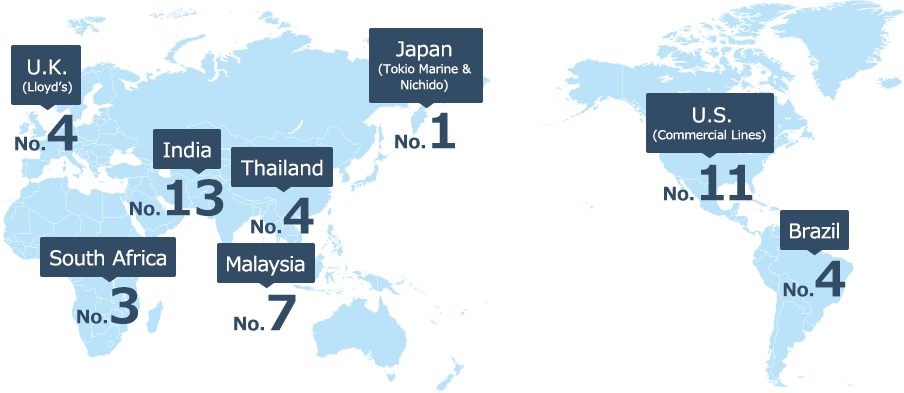
Operating Presence
Network encompassing Japan and 56 countries and regions worldwide
-
Sources:AXCO, IRDAI, IPRB, SUSEP, Swiss Re, FSCA Financial Sector Conduct Authority, S&P Capital IQ, PA annual report, Global Data forecasts, KPMG insurance survey, and Public documents from various companies
-
*The given country based on non-life insurance premiums
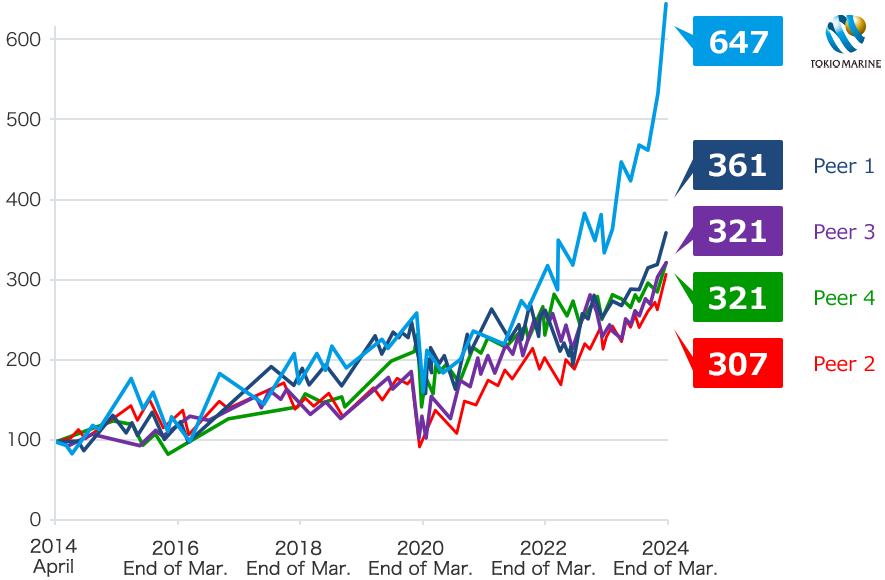
Shareholder Value
Realized above market and peers TSR
-
*As of end of March 2026
-
Source:Bloomberg
-
*Total Shareholder Return (TSR): Capital return after reinvesting dividends. Stock price indexed at 100 as of Mar 31, 2016.
-
*Peers are Allianz, AXA, Chubb and Zurich.
Financial Base
High ratings from third party ratings institutions
- S&PA+
- Moody’sAa3
- A.M. BestA++
-
*Financial strength rating of Tokio Marine Nichido (as of end of June 2025)
ESG Rating
High evaluations from various global ESG rating institutions
- MSCIAA
- CDPA
- S&P Global16years
consecutively
-
*As of August 2025
(Reference) Market Environment
Further profit growth in the United States, the largest insurance market, expansion in emerging markets, and stable growth in Japan are the key.
The global insurance market in 2022 was worth 6.782 trillion dollars, with the United States in first place for both life and non-life insurance. Rising insurance premiums and the appreciation of the U.S. dollar have expanded the U.S. market to account for 40% of the global insurance market. Partly due to the impact of FX, Japan ranked fourth, eighth in the non-life insurance market and fourth in the life insurance market.
Ten Largest Insurance Markets in Direct Premiums Written for Life Insurance and Non-life Insurance in 2022
| Ranking | Country | Life premiums | Non-life premiums | Total premiums | ||
|---|---|---|---|---|---|---|
| Amount | Change against 2019 (%) | Share of the global total (%) | ||||
| 1 | United States | 672,006 | 2,287,801 | 2,959,808 | 8.6 | 43.6 |
| 2 | China | 364,359 | 333,448 | 697,806 | 0.2 | 10.3 |
| 3 | United Kingdom | 248,240 | 114,769 | 363,009 | -2.8 | 5.4 |
| 4 | Japan | 243,892 | 93,920 | 337,812 | -15.1 | 5.0 |
| 5 | France | 157,179 | 104,075 | 261,254 | -10.7 | 3.9 |
| 6 | Germany | 99.164 | 142,469 | 241,633 | -11.3 | 3.6 |
| 7 | South Korea | 88,026 | 94,820 | 182,846 | -5.3 | 2.7 |
| 8 | Canada | 71,639 | 99,332 | 170,972 | 2.8 | 2.5 |
| 9 | Italy | 115,938 | 44,229 | 160,168 | -16.5 | 2.4 |
| 10 | India | 99,503 | 31,538 | 131,041 | 6.5 | 1.9 |
-
Source:Swiss Re Institute, sigma No. 3, 2023
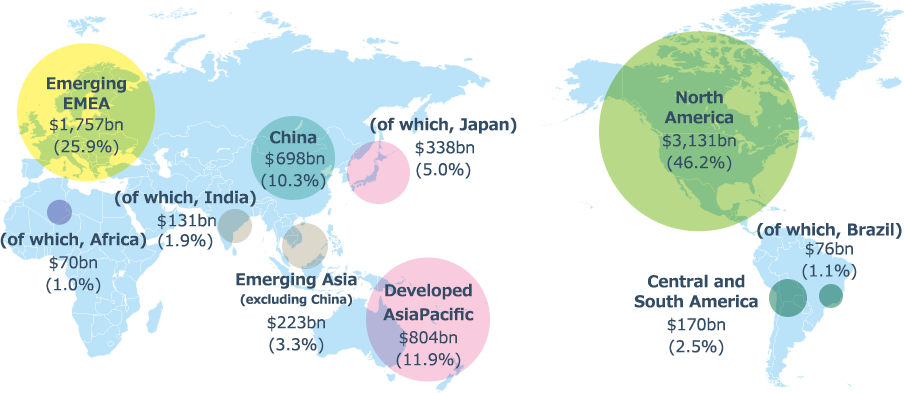
Life and Non-Life Insurance Premiums in 2022
Region Premium (Share)
-
*Circle size gives a visual idea of the size of premiums
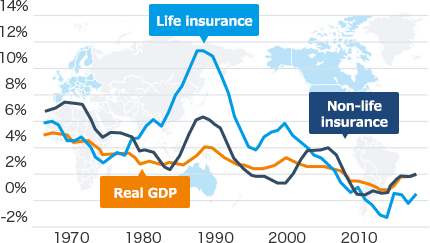
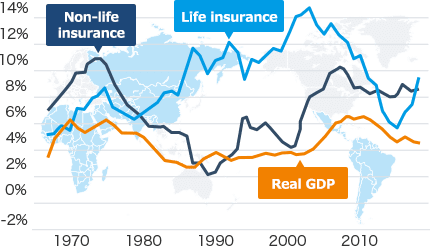
In addition to stable growth in developed markets, capturing booming emerging markets is the key.
Non-life premiums grow in tandem with economic growth in developed markets. However, in emerging markets, which have low levels of insurance penetration and upward trends in populations, insurance premiums show growth that exceeds economic growth. Note that increases in life premiums are greatly impacted by such factors as interest rates, market regulations, and taxation systems, so they are not necessarily linked to economic growth.
Growth in Non-life and Life Premiums, and Growth in Real GDP (Seven-Year Moving Average)
Developed Markets
Emerging Markets
-
Source:Swiss Re Institute, sigma No. 3, 2018