The August 2026 Chiba Heavy Rainfall: Overview of Flood Damage and Preparedness for Urban Flooding
- Social Issues & Advancing Society
-
*This article is an edited version of an article previously published by Tokio Marine dR Co., Ltd.
(Source: Ministry of Land, Infrastructure, Transport and Tourism, Kanto Regional Development Bureau, PDL1.0)
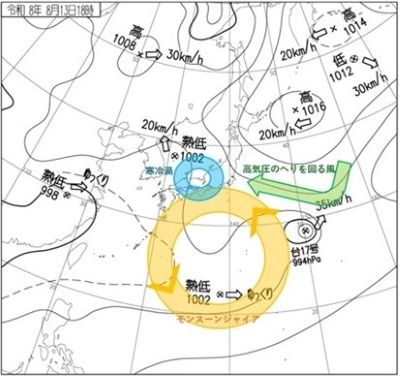
On August 13 and 14, 2026, a linear rainband caused record-breaking heavy rainfall in Chiba, leading to flooding and damage. This article provides an overview of the event based on information as of August 19, when the original article was written.
1. Record-breaking heavy rainfall
with additions by Tokio Marine dR.
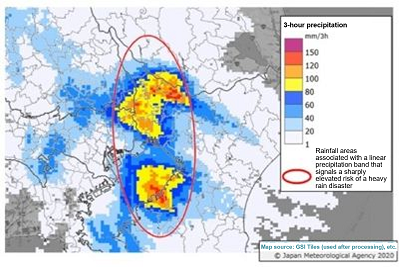
Because of this heavy rain, Level 5 Emergency Warnings for Heavy Rain and Level 5 Emergency Warnings for Landslide Disaster were issued across a wide area of Chiba Prefecture.
| Prefectures | Municipalities | Location | Updated values | Highest value recorded through the 12th |
Start Year of Statistics |
||
|---|---|---|---|---|---|---|---|
| mm | Time (until) | mm | Date | ||||
| Chiba Prefecture | Abiko City | Abiko | 61 | 14:30 | 53.5 | 2016/7/20 | 2010 |
| Chiba Prefecture | Funabashi City | Funabashi | 62 | 18:43 | 58.5 | 2013/10/16 | 1999 |
| Chiba Prefecture | Sakura City | Sakura | 97 | 19:31 | 68.5 | 2015/6/23 | 1976 |
| Chiba Prefecture | Chuo Ward, Chiba City |
Chiba * | 115 | 18:48 | 71 | 1975/10/5 | 1966 |
| Chiba Prefecture | Tateyama City | Tateyama * | 94.5 | 21:53 | 74.5 | 1972/9/15 | 1968 |
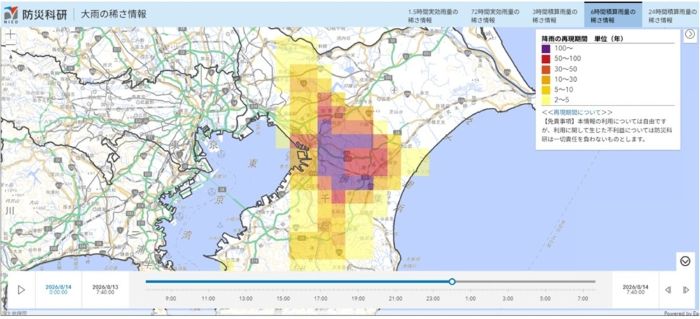
On August 14, the 6-hour cumulative rainfall is estimated to have exceeded the scale of a once-in-100-years event in Chiba City and Yotsukaido City (Figure 3)*7.
2. Flooding
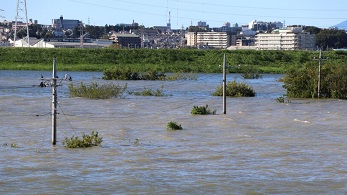
The heavy rain described in section 1 caused inundation from what is believed to be both pluvial and fluvial flooding in various parts of Chiba Prefecture. Pluvial flooding is when rainwater exceeds the drainage system’s capacity from irrigation channels, manholes, and so on. Fluvial flooding is when river water overflows into urban areas due to overtopped levees or levee breaches. Further detail on the areas believed to have been inundated can be found in "Response to the August 2026 Chiba Heavy Rain: Materials for the 5th Chiba Prefecture Disaster Response Headquarters Meeting"*8.
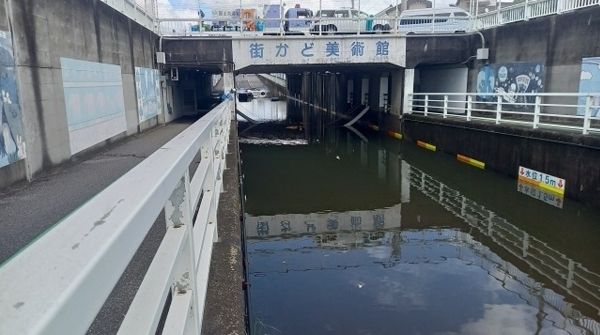
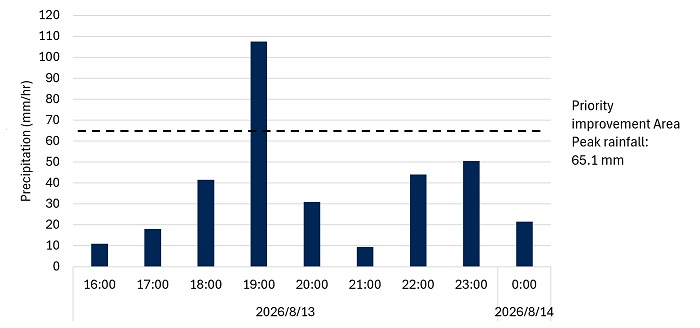
The August heavy rainfall event is believed to have caused widespread pluvial flooding, including the inundation of roads and underpasses, across various parts of Chiba. As a measure to prepare for pluvial flooding, Chiba City formulated the “Basic Policy for Priority Improvement Area for Rainwater Management in Chiba City”*9 (planning period: 2018 to 2038), strengthening rainwater management by setting the peak hourly rainfall at 65.1 mm in development priority districtsiii and 53.4 mm per hour in general districts. The hourly precipitation observed during this event in Chiba City was 115 mm (Table 1), amounting to approximately twice the rainfall specified in the Basic Policy above, and exceeding drainage capacity.
There have been numerous recorded cases of urban flooding caused by torrential rain, particularly in Tokyo. (For inundation records in Tokyo, see the "Flood Risk Information System" *10). Urban flooding is characterized by inundation even in areas far from rivers, and by the rapid expansion of damage over a short period of time.
In Chiba City, the inundation hazard map for rainwater overflow (pluvial flooding) was designated on March 31, 2026*11, and it shows inundation in the event of the assumed maximum rainfall (153 mm of hourly rainfall). However, media reports and other sources have also indicated that, in this heavy rain event, inundation also occurred outside the projected inundation area. This is thought to be due to differences between the rainfall distribution and intensity assumed in the inundation hazard map and the actual rainfall conditions. As shown in Figure 4, even though the hourly rainfall did not reach 153 mm, intense rain of about 30 mm and 40 mm fell around the peak period from 18:00 to 19:00, and heavy rain of about 40 to 50 mm also fell around 22:00 and 23:00. It is hypothesized that drainage could not keep up, even outside the projected inundation area.
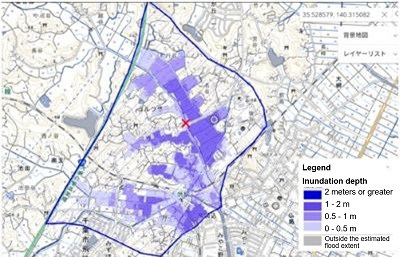
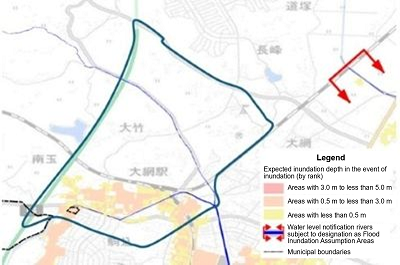
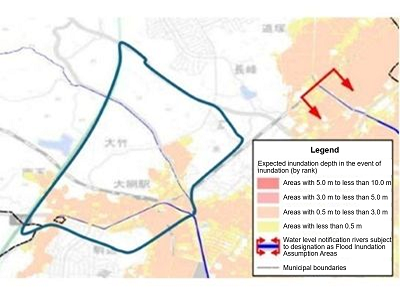
Furthermore, this heavy rainfall event caused extensive fluvial flooding damage in Oamishirasato City. The following compares the estimated inundation around Oami Station in Oamishirasato City (Figure 7) with the inundation hazard maps (Figures 5 and 6). Figure 6 is a flood inundation hazard map (planned scale)*13 for the Nabaki river system flowing through Oamishirasato City. The Konaka River, where flooding occurred during this event, is also included in the area assessed. As shown in Figures 5 and 6, the extent of inundation on the southern side of the inundation estimation map (south of the Sotobo Line) generally corresponds to that shown on the inundation hazard map. However the extent of inundation on the northern side extends beyond the area indicated on the hazard map. In addition, even in the flood inundation hazard map for the assumed maximum scale (Figure 7)*14, part of the area shown in the inundation estimation map (Figure 5) lies outside the inundation area in the inundation hazard map. As stated above, one possible factor for this discrepancy is the difference between the rainfall distribution assumed in the flood inundation hazard map and the actual rainfall distribution. It is also possible that pluvial flooding and flooding of tributaries, which were not assumed in Figures 6 and 7, also occurred.
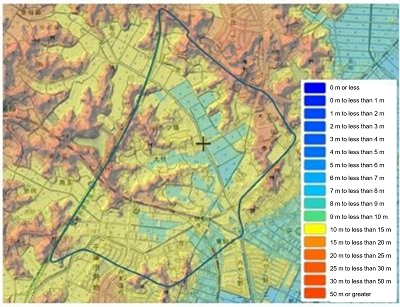
As shown in Figure 8, the inundated area (Figure 5) was at a lower elevation than the surrounding areas:*15 terrain where water could easily collect. It is important to recognize that inundation may occur even outside the projected inundation area in low elevation areas. To prepare for such situations, please also refer to the Tokio Marine dR article: “How to Interpret Flood Risk and Relate It to Your Daily Life :(1) Visualize How Water Moves”).
(planned scale)*13 (partially revised by Tokio Marine dR)
(Prepared by Tokio Marine dR based on the GSI Maps*15)
3. Urban flooding damage and countermeasures
As described in the previous section, this heavy rainfall event was characterized by urban flooding. This section (based on information released at noon on August 19) summarizes damage specific to urban flooding and introduces measures that can help reduce the impact of similar events in the future.
3.1. Urban flooding damage
A) Vehicle inundation*16,17,18
This torrential rain caused numerous cases of vehicle inundation damage. As of 4pm on August 18, three people are reported to have died after being trapped in submerged vehicles. As of 1pm on August 17, in Chiba City alone, approximately 2,500 vehicles were unable to move due to breakdowns and had been abandoned. Rear-end collisions with abandoned vehicles were also observed.
B) Underground inundation*19,20
Another characteristic type of damage caused by urban flooding is underground inundation. As of 5am on August 18, power outages and water outages were ongoing in at least 12 apartment buildings in Chiba City. There was no problem with the power company's supply. The cause is believed to have been a failure of the condominium's basement electrical equipment due to inundation.
In addition, at a general hospital in Chiba City, inundation caused electrical equipment in the basement to malfunction, and a power outage was ongoing. As of 4pm on August 18, medical services were suspended without scheduled resumption.
3.2. Measures against urban flooding
A) Vehicle inundation*21,22,23,24
If a vehicle is driven on a flooded road, water may enter the engine through the air inlet or inundate it through the exhaust muffler, causing the engine to stop and making it impossible to restart. To avoid damage, do not go near places at risk of inundation, such as underpasses and areas along rivers. Also, even if the vehicle ahead can pass through, it does not necessarily mean that your vehicle can too. Do not attempt to follow others or force your way through.
If your engine stops while driving, avoid forcing a restart in order to prevent further damage. Instead, turn on the hazard lights to ensure safety and contact roadside assistance. Remember, human life comes first. If water begins entering the vehicle, evacuate immediately. Water pressure may prevent the doors from opening, so it is also important to keep an emergency escape hammer in the vehicle.
B) Inundation of underground spaces*25,26,27,28
Beyond heavy rain, urban areas have repeatedly suffered damage from the inundation of underground shopping malls, basements, and similar spaces. Underground spaces are particularly vulnerable to short-term heavy rainfall because structurally, they tend to concentrate rainwater from surrounding areas. Such underground inundation must not be taken lightly. Fatal accidents have occurred.
The most common measure to address underground inundation is to install flood barriers. Flood barriers effectively prevent inundation through entrance and exit openings, but because they must be installed, it is important to plan in advance and conduct regular drills.
Installing electrical equipment at higher elevations whenever possible can also help prevent damage caused by flooding. If underground installation is unavoidable, measures such as waterproof doors and elevating the equipment can prevent damage such as power outages.
Meanwhile, for individuals, it is important not to approach an underground space carelessly during heavy rain. Once inundation begins, water levels rise rapidly, making evacuation difficult.
Finally, be sure to check disaster preparedness supplies, confirm evacuation routes, and identify hazardous locations using a hazard map as you prepare not only for heavy rain disasters, but for disasters in general.
4. Future possibilities
Could a heavy rain disaster like this occur again in the future? Are we experiencing the impacts of climate change?
First, let's review the weather conditions. Monsoon gyres have occurred many times in the past. Meanwhile, a Cold vortexis a meteorological phenomenon that frequently occurs due to the meandering of the jet stream. Therefore, although it is rare for these weather conditions to occur together, such a combination of conditions isentirely possible.
With regard to climate change, it is generally known that, due to the increase in the amount of water vapor in the atmosphere associated with global warming, extreme precipitation tends to intensify. However, the body of accumulated research is not yet sufficient to establish the relationship between individual phenomena such as monsoon gyres Cold vortices, and the wider global phenomenon of climate change. In recent years, event attribution research, which quantitatively evaluates the impact of global warming on specific meteorological events using climate models, has been attracting attention. This event in Chiba may be analyzed using this approach in the future. Past event attribution research on heavy rain events has reported results indicating that global warming contributed to increased precipitation*29.
In addition, future projections by the Japan Meteorological Agency and the IPCC*30 indicate that, as warming progresses, the frequency and intensity of extreme heavy rainfall may increase further. In light of these trends, it is necessary to recognize that similar heavy rain could occur at any time and in any place in the future.
5. Summary
Regarding the August 2026 Chiba heavy rain that occurred on August 13 and 14, 2026, this article summarizes the weather conditions that caused the heavy rain event, compares the inundation conditions with the inundation hazard map, provides an overview of the damage, and examines future possibilities. The following points are suggested:
-
Weather conditions like those seen in this event have occurred in the past, and similar heavy rain could occur again at any time and in any location in the future.
-
As global warming progresses, the frequency and intensity of extreme heavy rainfall events may increase further.
-
Actual rainfall events often differ from the rainfall assumed in the inundation hazard map. As a result, inundation may occur even outside designated flood-risk areas, and special caution is required in low elevation areas.
-
In areas highly urbanized areas, damage specific to urban flooding, such as vehicles being submerged and inundation of underground facilities, may continue to occur in the future.
Interested in a deeper look at flood risk?
Tokio Marine dR Co., Ltd. publishes articles explaining how to interpret flood risk, articles compiling flood risk information, and articles comparing actual flood cases with hazard maps.
How to Interpret Flood Risk and Relate It to Your Daily Life: (1) Visualize How Water Moves (August 15, 2024)
Essential Flood Risk Information You Should Know <2023 Edition> (September 1, 2023)
What Is the Newly Published "Flood Risk Map"? (December 29, 2022)
Preparing for Flooding in Small and Medium -Sized Rivers—Characteristics of Flooding and the Use of Disaster Preparedness Information— (July 30, 2026)
How to Read Flood Hazard Map Through Case Studies (For Advanced Readers) (September 1, 2023)
Tokio Marine & Nichido Fire Insurance Co., Ltd. introduces knowledge and information that is useful for disaster preparedness and mitigation.
For Tomorrow's Smiles: Disaster Preparedness and Mitigation Effort Information Website: Tornadoes and Heavy Rain
References
-
*1Kyushu University, "Elucidating the true nature of the monsoon gyre that appears in midsummer: The outer circulation of a typhoon forms a giant vortex " (checked on August 17, 2026)
-
*2Fujiwara et al., 2026: Monsoon gyres over the western North Pacific in mid-summer on monthly and synoptic scales, Atmospheric Research, 329, 108507 (checked on August 20, 2026)
-
*3Ministry of Education, Culture, Sports, Science and Technology Grants-in-Aid for Scientific Research, Grant-in-Aid for Scientific Research on Innovative Areas “Mid-latitude Atmosphere-Ocean Interaction Hotspot in a Changing Climate System” (checked August 17, 2026)
-
*4Japan Meteorological Agency website, "Past Weather Maps" (checked August 17, 2026)
-
*5Japan Meteorological Agency website: “Press Release Materials for 2026: Level 5 Heavy Rain Emergency Warning Issued for Chiba Prefecture” (checked on August 17, 2026)
-
*6Japan Meteorological Agency website “Status of Updates to Monthly Record-Highs in Observational History” (checked on August 17, 2026)
-
*7National Research Institute for Earth Science and Disaster Resilience, Department of Water-Related Disaster Research, Extreme Weather Disaster Research Domain “Heavy Rain in Chiba Prefecture on August 13, 2026” (checked on August 17, 2026)
-
*8Chiba Prefecture, "Response to the August 2026 Chiba Heavy Rain: Materials for the 5th Chiba Prefecture Disaster Response Headquarters Meeting" (checked on August 17, 2026)
-
*9Chiba City "Basic Policy for the Development of Priority Districts for Stormwater Management PDF" (checked on August 17, 2026)
-
*10Tokyo Metropolitan Government “Flood Risk Information System” (checked on August 20, 2026)
-
*11Chiba City, "Inundation Hazard Map for Rainwater Runoff (Designated Area) (Expected Water Depth in the Event of Inundation)" (checked on August 17, 2026)
-
*12Japan Meteorological Agency “Historical Weather Data Download”
-
*13Chiba Prefecture, "Nabaki River in Nabaki river System flood inundation hazard map (planned scale)" (checked on August 17, 2026)
-
*14Chiba Prefecture, "Nabaki River in Nabakigawa river system flood inundation hazard map (Assumed Maximum Scale)" (checked on August 17, 2026)
-
*15Ministry of Land, Infrastructure, Transport and Tourism, Geospatial Information Authority of Japan, ""GSI Maps" (checked on August 18, 2026)
-
*16Chiba Prefecture "Regarding the August 2026 Chiba heavy rain (Report No. 13)" (checked: August 19, 2026, 12:00)
-
*17Ministry of Land, Infrastructure, Transport and Tourism "Regarding Damage and Other Conditions Caused by the August 2026 Chiba Heavy Rain (Report 8)" (checked: August 19, 2026, 12:00)
-
*18Chiba City "Status of response to abandoned vehicles on roads (*as of 13:00 on August 17)" (checked: August 18, 2026, 14:30)
-
*19NHK "Chiba: Underground electrical equipment submerged in heavy rain; power outage and water service suspension continue in 12 apartment buildings" (checked: August 19, 2026, 12:00)
-
*20NHK "General hospital in Chiba suspends medical services as power outage continues due to heavy rain; no prospect for resumption" (checked: August 19, 2026, 12:00)
-
*21JAF "Safety Precautions for Cars During Typhoons and Heavy Rain" (checked: August 19, 2026, 12:00)
-
*22JAF "[Q] What should you do if your vehicle becomes inundated on a flooded road or by storm surge?" (checked: August 19, 2026, 12:00)
-
*23Ministry of Land, Infrastructure, Transport and Tourism: "Once the water depth exceeds floor level, it is already dangerous! - Issues that occur when a vehicle travels on a flooded road -" (checked: August 19, 2026, 12:00)
-
*24Ministry of Land, Infrastructure, Transport and Tourism: "Prepare for heavy rain by equipping your car with an escape hammer! ~How to Use and Choose an Escape Hammer~" (checked: August 19, 2026, 12:00)
-
*25Ministry of Land, Infrastructure, Transport and Tourism "Cases of Inundation in Underground Space" (checked: August 19, 2026, 12:00)
-
*26Ministry of Land, Infrastructure, Transport and Tourism, "Guidelines for Inundation Countermeasures in Underground Space" (checked: August 19, 2026, 12:00)
-
*27Ministry of Land, Infrastructure, Transport and Tourism, Chubu Regional Development Bureau, Mie Office of River and National Highway, "Yokkaichi City Underground Parking Facility Restoration Review Committee Final Report" (checked: August 19, 2026, 12:00)
-
*28Tokyo Metropolitan Government "Tokyo Disaster Preparedness Guidebook" (checked: August 19, 2026, 12:00)
-
*29Tradowsky et al., 2023: Attribution of the heavy rainfall events leading to severe flooding in Western Europe during July 2021, Climate Change, 176, 90, doi: 10.1007/s10584-023-03502-7
-
*30IPCC "Sixth Assessment Report" (checked on August 17, 2026)
Footnote
-
iMonsoon gyre: a large counterclockwise circulation that develops over the ocean south of Japan in midsummer
-
iiCold vortex: a type of low-pressure system. It occurs particularly in the middle to upper troposphere (approximately 5,000 to 10,000 m above ground level).
-
iiiPriority Improvement Area: an area with a high risk of inundation, including above-floor inundation during heavy rain, where urban functions to which damage would cause major economic losses are concentrated
-
ivIPCC: Intergovernmental Panel on Climate Change
-
*Only available in Japanese
-
Authors:Nobuto Moriguchi, Senior Researcher, Tokio Marine dR Co., Ltd.
Daiki Watanabe, Researcher, Tokio Marine dR Co., Ltd.
Rumi Ogaichi, Senior Principal Researcher, Tokio Marine dR Co., Ltd.
Takumi Tomioka, Senior Researcher, Tokio Marine dR Co., Ltd.